


Innoship | 12 March 2026 | Feature Updates
Feature Updates
How to optimize your deliveries using a live logistics dashboard and real-time visibility
IT applied to logistics has changed the way daily deliveries are managed. Volumes are increasing, delivery promises are becoming stricter, and customers expect clear, timely information. In this context, static reports and manually updated files no longer provide the support needed for fast, informed decisions.
The goal of this article is straightforward: to show how a live logistics dashboard, powered by real-time data, helps you optimize deliveries, anticipate operational issues, and gain full visibility into orders. You will find a practical approach, concrete implementation steps, and real-world examples already used by eCommerce and omnichannel retail companies across Europe.
Context and objectives: why real-time visibility changes the way you work
Delivery has become a direct extension of the customer experience. For most customers, order status and on-time delivery matter just as much as the product itself. Without access to live data, teams react too late, and customer communication becomes defensive.
Real-time visibility allows you to see what is happening right now across your logistics network. You can identify delays before they escalate, spot performance differences between carriers, and adjust decisions daily. A live dashboard supports clear goals: more predictable deliveries, controlled costs, and fewer requests to the support team.
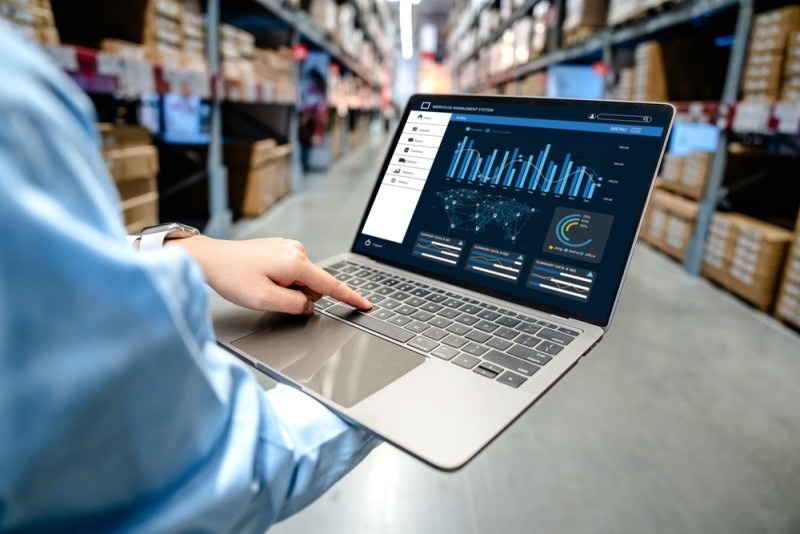
What a live logistics dashboard means beyond basic tracking
A live logistics dashboard goes far beyond showing a parcel’s location. It centralizes operational data across the entire delivery flow—from shipment creation to delivery confirmation or return initiation.
Unlike traditional tracking, which answers “Where is the parcel?”, a live dashboard answers “What will happen next?”. You see dynamically recalculated ETAs, active exceptions, warehouse bottlenecks, and carrier performance by region and time window. In day-to-day operations, this perspective helps teams prevent issues rather than simply acknowledge them.
Technical components of an effective logistics dashboard
A dashboard performs well when the IT architecture supports a continuous data flow. Visual design matters, but real value comes from connected data sources and proper synchronization.
In most cases, data sources include:
- TMS (Transportation Management System) for delivery allocation and tracking
- WMS (Warehouse Management System) for order preparation status
- ERP (Enterprise Resource Planning) for commercial and financial data
Connections are made through APIs (Application Programming Interfaces), enabling automated data exchange between systems. An ETL flow (Extract, Transform, Load) normalizes the data so delivery statuses are consistent across carriers and regions.
For visualization, many teams use Grafana, Power BI, Tableau, or Looker. Regardless of the tool, UI/UX should be action-oriented: clear exception lists, performance maps by region, and easy-to-read indicators.

Step-by-step implementation: how to optimize deliveries with live data
1. Define operational performance objectives
Start by defining what you want to improve. Common objectives include average delivery time, on-time delivery rate (OTD), cost per parcel, and failed delivery rate.
Link each objective to concrete decisions. For example, if increasing OTD is the goal, analyze delays by carrier and region—not just total order volume. Clear objectives guide dashboard design and prevent displaying data with no practical value.
2. Select KPIs that support daily decision-making
KPIs must directly reflect your objectives. For most operations, metrics such as OTD, the gap between estimated and actual ETA, exception rate, and average resolution time provide actionable insights.
Avoid dashboard overload. A focused set of KPIs, monitored consistently, enables faster reactions. As a starting point, you can use tools like Innoship Free Analytics to establish a performance baseline without complex configuration.
3. Configure data sources and the live dashboard
Connect all relevant sources into a single data stream. Integrate carriers, order platforms, and internal systems through standardized APIs. Normalize statuses so the same delivery stage has the same meaning regardless of carrier.
Build simple visualizations:
- performance maps by region
- active exception lists
- carrier comparisons over time
An effective dashboard highlights what needs immediate attention and provides context for decisions—without complex interpretation.
4. Define alerts and clear thresholds
Alerts separate passive monitoring from operational control. Set thresholds for delays, failed deliveries, or warehouse bottlenecks. When deviations occur, the system sends automatic notifications to the responsible team.
For stable results, alerts must be relevant and limited. Notifications should appear only when there is a real risk. This reduces manual checks and enables action before issues reach the customer.
5. Monitor operations in real time
Use the dashboard daily as a working tool. Track active routes, delivery statuses, and carrier capacity. Live visibility allows you to reassign orders or reroute shipments before deliveries fail.
This practice reduces WISMO (“Where is my order?”) requests and gives support teams a single source of truth. Everyone works with the same constantly updated data.
6. Analyze historical data and optimize routes
After several weeks of data collection, clear patterns emerge. You identify frequent delay zones, problematic time windows, or carriers consistently performing below average.
Use these insights to adjust order allocation rules. In practice, companies often see cost reductions of up to 20% and around a 15% increase in on-time delivery after data-driven optimization.
7. Apply changes gradually and test in a controlled way
Implement changes on a limited order volume or within a specific region. Monitor results directly in the dashboard and compare them with previous periods.
A pilot approach reduces risk and provides clear data for scaling decisions. Adjust rules quickly without impacting the entire operation.
8. Use practical examples and benchmarks
Compare internal performance with market data or across regions. Benchmarks by carrier, zone, or delivery type help set realistic targets and support management decisions.
Modern platforms provide this context with minimal effort, turning the dashboard into a planning tool—not just a reporting interface.
Alerts and monitoring: operational control without constant supervision
A well-configured alert system allows teams to focus on exceptions rather than repetitive checks. Notifications appear only when deviations from defined parameters occur.
For customers, live visibility should translate into proactive, transparent communication. Automated notifications and status updates reduce uncertainty and increase trust. Examples from How to keep your customers informed show the direct impact of transparency on satisfaction and retention.
Optimization strategy: routing and incident management
Routing based on live data changes how orders are allocated. You select the best-performing carrier for a specific region and time window, based on historical data and current capacity.
When incidents occur, the dashboard provides full context: issue location, available alternatives, and delivery impact. Teams can quickly decide whether to reroute shipments or inform customers with updated estimates.
Tools and integration into the existing ecosystem
Integration with existing systems reduces implementation time and avoids data silos. A logistics dashboard should connect easily to TMS, WMS, ERP systems and multiple carriers from a single point.
You can explore Innoship integrations to centralize data and eliminate duplicate work. Process automation—such as shipment document generation—improves data accuracy and reduces operational errors.
Security and confidentiality: protecting logistics data
Logistics data includes customer, route, and partner information. Protect it through encryption, role-based access control, and activity audits.
Choose solutions with clear security policies and high uptime. A live dashboard must deliver stability and trust, especially for high-volume, cross-border operations.
Case studies and real-world examples
Retailers and marketplaces in Central and Eastern Europe use live dashboards to manage multi-carrier networks and high volumes. Innoship works with over 250 clients connected to 85+ carriers across 15 countries, including Romania, Poland, and the Czech Republic.
For deeper insight into advanced tracking value, the analysis on professional courier tracking shows how operational data supports daily decisions and continuous optimization.
Conclusion and next steps
Real-time visibility gives you control over deliveries and supports data-driven decisions instead of assumptions. A live logistics dashboard helps teams anticipate problems, optimize routes, and communicate better with customers.
Practical next steps:
- start a pilot on a controlled order volume
- analyze results directly in the dashboard
- expand implementation regionally or across markets
For complex infrastructures, specialized IT consulting accelerates implementation and reduces technical risk.
See how the courier performance dashboard works and start working with real data—every day.
FAQ
1. What is a live logistics dashboard and how is it different from standard tracking?
A live logistics dashboard centralizes real-time operational data across the entire delivery flow, not just parcel location. It shows dynamic ETAs, active exceptions, carrier performance, and upcoming risks, helping teams act before issues impact customers.
2. Do I need to replace my existing TMS, WMS, or ERP to use a live dashboard?
No. A live logistics dashboard typically integrates with existing systems through APIs. It connects to your TMS, WMS, ERP, and carriers, consolidating data without replacing your current infrastructure.
3. What KPIs are most important for optimizing deliveries in real time?
Commonly used KPIs include on-time delivery rate (OTD), ETA deviation, exception rate, cost per shipment, and average incident resolution time. The right KPIs depend on your operational goals and should directly support daily decisions.
4. How quickly can a company see results after implementing a live dashboard?
Many teams see improvements within a few weeks, once enough data is collected to identify patterns. Typical results include fewer delivery exceptions, reduced support tickets, better carrier allocation, and lower delivery costs.
5. Is a live logistics dashboard suitable for multi-carrier and cross-border operations?
Yes. Live dashboards are especially valuable in multi-carrier and cross-border setups, where performance varies by region and partner. Real-time visibility helps standardize data, compare carriers, and manage complexity at scale.
